
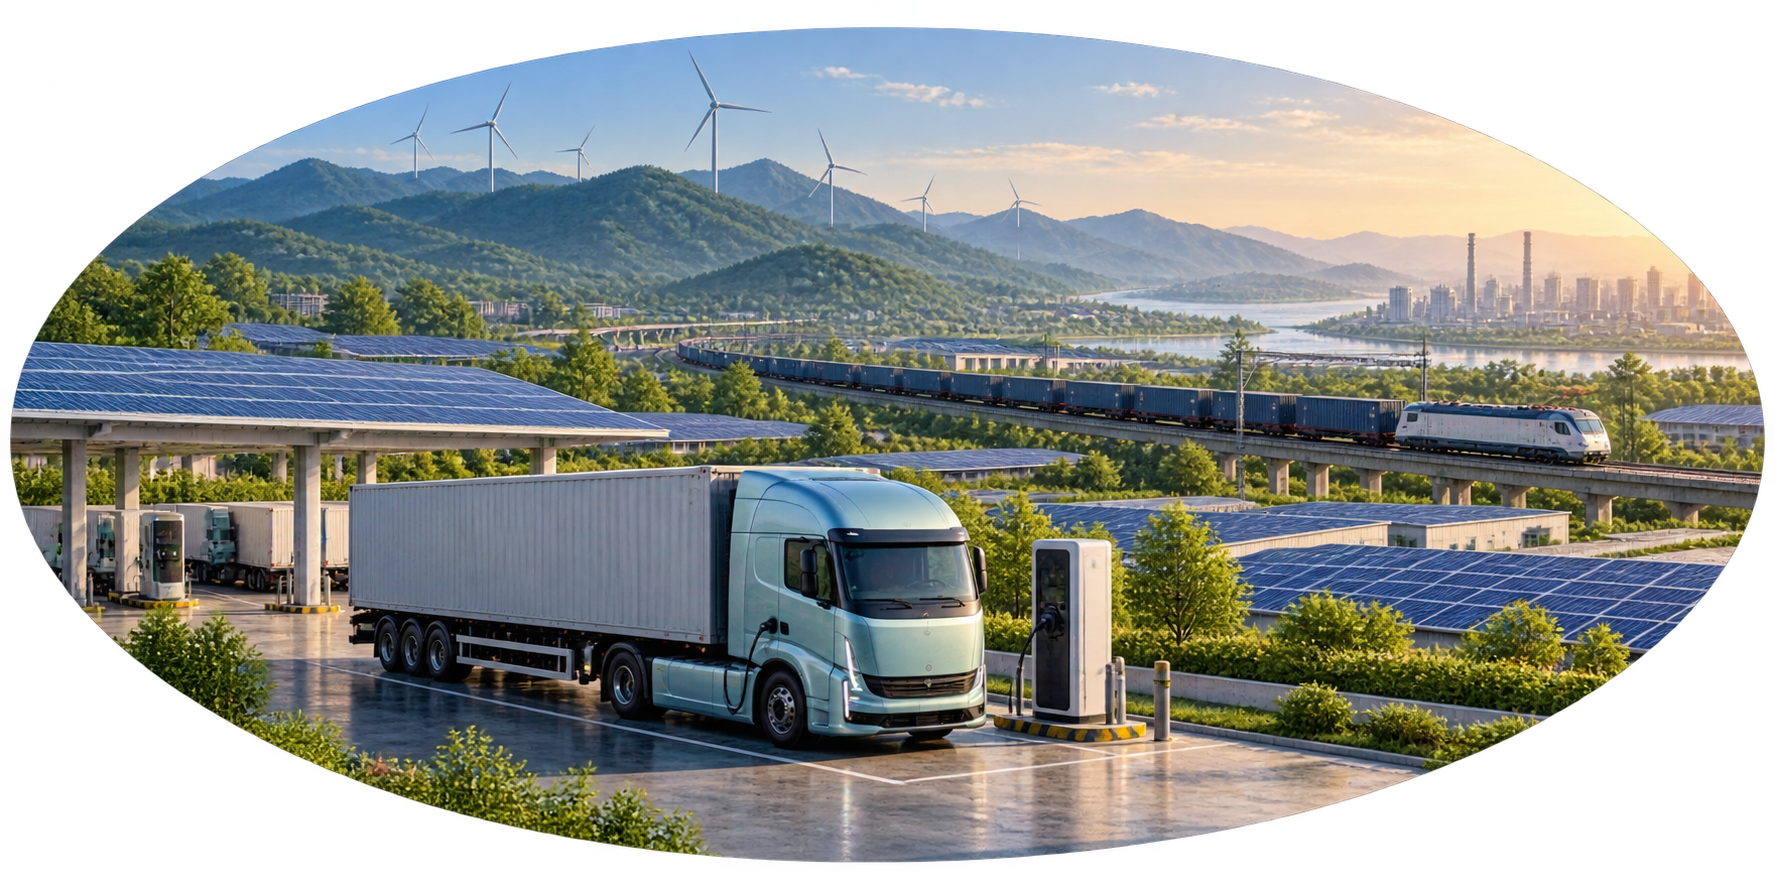
China is routinely invoked as a reason why climate action elsewhere is pointless. Yet the country is installing renewable energy, selling electric vehicles and electrifying freight on a scale that much of the world has yet to match. An honest environmental account must recognise that progress as clearly as it recognises China’s continuing dependence on coal.
That does not make China the world’s greenest country. It makes the familiar picture of a country doing little or nothing about the transition indefensible. The useful question is which parts of its economy are changing, how much they are changing and whether that change is reducing environmental harm.
Evidence checked to 31 October 2026. Annual comparisons below use the stated observation year, not the publication year. The featured image is an AI-generated editorial composite, not a photograph of a named facility. Diagrams are original explanatory summaries.
The scale of the renewable build-out
The International Energy Agency reports that China added nearly 500 gigawatts of renewable generating capacity in 2025, accounting for over 60% of global additions. On that measure, its additions exceeded those of the rest of the world combined. The IEA’s series includes approximately 370 GW of solar PV and 117 GW of wind.[1]
These are capacity figures: the rated power of equipment installed. They are not the electricity those installations actually delivered. Solar statistics can also differ between datasets because of capacity conventions, coverage and revisions; comparisons should stay within a consistent series.
The influence extends beyond China’s borders. The IEA estimates that China holds around 85% of solar and 80% of lithium-ion battery supply-chain production capacity. Its manufacturing role is consequently central to the international transition, while the concentration also raises legitimate supply-security concerns.[2]
Recognising an industrial achievement does not require endorsing a government’s political system. Nor does concern about dependence on one supplier justify pretending the supplier’s contribution does not exist.
1. Equipment installed
Capacity, measured in GW, describes rated power—not annual electricity delivered.
2. Electricity delivered
Output, measured in GWh or TWh, depends on resources, availability and grid access.
3. Fossil generation displaced
Useful clean output must replace fossil output, or meet demand that would otherwise require it.
4. Emissions outcome
Assess the resulting emissions alongside demand growth, industry and other fuels.
Read left to right, or top to bottom on a narrow screen. A conceptual explanation, not a measured forecast. Grid and integration context: [17]
Electric cars have moved beyond a niche
More than 13 million electric cars were sold in China in 2025, approximately six in ten electric cars sold worldwide. They represented almost 55% of its new-car market. But the IEA’s electric-car category includes battery-electric vehicles and plug-in hybrids; it does not mean every vehicle counted runs exclusively on batteries.[3]
Sales are also different from the fleet already on the road. The IEA estimates that electric cars represented around 13% of China’s car stock at the end of 2025. Replacing a large vehicle fleet takes time, even when new sales change rapidly.
China is not the leader on every measure of adoption. Norway’s battery-electric share of new passenger-car registrations reached 95.9% in 2025. That is a much higher percentage in a much smaller market. Scale and penetration describe different achievements.[18]
Electric haulage: the development that deserves more attention
China accounted for over 90% of global electric-truck sales in 2025. Roughly one in four new trucks sold there was electric; among heavy freight trucks, the share reached 28%, up from 13% in 2024. These figures describe the IEA’s medium- and heavy-freight categories, not all commercial vehicles or the entire existing fleet.[4]
Much of the deployment serves predictable routes around ports, mines, steelworks and industrial hubs. Those applications offer opportunities to plan charging, use vehicles intensively and, in some cases, swap batteries. They are substantial commercial uses, rather than evidence that every long-distance diesel route has already been replaced.
The IEA identifies falling battery costs, operating-cost advantages and policy support as drivers. Electric trucks remain expensive upfront, but lifetime ownership costs can already be competitive in China. This is an industrial and economic transition as well as an environmental one.[5]
It is reasonable to ask how much of the next stage can extend into longer-distance freight. It is unreasonable to dismiss the current stage because it has not solved every application.
Does coal-powered charging cancel the benefit?
Battery manufacturing creates emissions, and charging on a fossil-heavy grid creates more. Neither should be omitted. Nevertheless, the IEA’s lifecycle analysis finds that comparable battery-electric cars have lower lifetime greenhouse-gas emissions than petrol cars even in China, India and other coal-dependent systems.[6]
The size of the saving depends on the vehicle, battery, driving distance and electricity supply. A plug-in hybrid’s result also depends on how often it actually runs electrically. Findings for passenger cars should not be copied into a truck calculation without accounting for different duties and equipment.
1. Manufacture
Count materials, vehicle production and battery production where relevant.
2. Energy supply
Count electricity generation for an EV; fuel extraction and refining for a petrol or diesel vehicle.
3. Use
Include energy consumed over the vehicle’s life. A battery EV has no exhaust CO₂, but is not impact-free.
4. End of life
Include treatment and recycling consistently for both vehicles before comparing totals.
Zero exhaust emissions and zero lifecycle emissions are different claims. Vehicle size, mileage and energy assumptions must match. Original schematic informed by the IEA’s lifecycle explanation.[6]
Which countries are greener than China?
The answer changes with the measure. A country can have cleaner electricity today while adding less new clean capacity. It can have a relatively dirty grid but use little electricity per person. No single label captures all three.
| Country | Low-carbon share | Wind + solar share | What the comparison shows |
|---|---|---|---|
| China | 42% | 22% | Benchmark; still heavily dependent on coal.[7] |
| France | 95% | 13% | Much cleaner electricity; nuclear supplies most generation.[8] |
| Brazil | 89% | 27% | Much cleaner electricity, largely renewable.[7] |
| United Kingdom | 64% | 36% | Cleaner electricity and a higher wind-and-solar share.[9] |
| Germany | 59% | 45% | Cleaner electricity mix, despite continuing coal use.[10] |
| United States | 43% | 19% | Similar low-carbon share; lower emissions per unit of electricity.[7] |
| India | 27% | 14% | More carbon-intensive electricity, but much lower demand per person.[7] |
Percentages are rounded. Low-carbon includes renewables and nuclear; wind and solar are a subset, not an additional share. Electricity generation is not total energy consumption. The comparisons use Ember’s series consistently rather than mixing small differences between datasets.
France, Brazil, the UK and Germany have cleaner electricity mixes than China. The US is close in low-carbon share, but its greater reliance on gas rather than coal lowers emissions per unit of electricity. India’s electricity is more carbon-intensive, yet its much lower electricity demand per person changes the per-person comparison.[7][8][9][10]
A cleaner power system is a major achievement, but not a complete environmental verdict. Electricity statistics do not settle questions about deforestation, imported consumption, water, biodiversity or resource extraction. Nuclear belongs in a low-carbon comparison, but it is not a renewable source.
| Country | Tonnes of CO₂ per person |
|---|---|
| United States | 14.2 |
| China | 8.7 |
| United Kingdom | 4.5 |
| India | 2.2 |
These rounded Global Carbon Budget figures, processed by Our World in Data, exclude land-use change and greenhouse gases other than CO₂. They allocate production emissions to the country where they occur, rather than to the final buyer of exported goods.[11]
On this measure, China performs better than the US but worse than the UK and India. Lower per-person emissions should not be confused with a cleaner electricity unit, just as lower national totals should not automatically be treated as evidence of stronger policy.
A broader environmental index tells another part of the story
Yale’s 2026 Environmental Performance Index assesses 177 countries across 47 indicators covering environmental health, ecosystems and climate. Selected positions are shown below; a lower rank number indicates a stronger result under that methodology.[12]
| Country | Overall rank out of 177 |
|---|---|
| United Kingdom | 3 |
| Germany | 6 |
| France | 7 |
| Norway | 8 |
| United States | 27 |
| Brazil | 50 |
| China | 129, joint |
| Indonesia | 168 |
| India | 176 |
China ranks below all the selected European countries, the US and Brazil, but above Indonesia and India. This index supports scrutiny of China’s wider environmental outcomes; it does not measure the absolute quantity of solar panels installed or electric trucks sold.
An index involves choices about indicators and weighting. Its underlying data also cover different years. Yale explicitly warns against treating ranks from different editions as a consistent time series because methods change. China’s current position therefore cannot simply be compared with an older edition to calculate how quickly it is improving.[13]
Coal remains a serious contradiction
China remains by far the largest coal consumer. The IEA reports that its total coal demand was broadly flat in 2025, even as coal-fired electricity generation declined. Reduced use in power and some heavy industries was offset by other demand, including chemicals. Almost 80 GW of coal-fired generating capacity entered operation that year.[14]
New plants create a continuing risk of dependence on fossil fuels. A stated role as backup does not by itself establish how often a plant will run, which generation it will displace or whether the investment makes eventual retirement more difficult.
The IEA estimates that China’s energy-related CO₂ emissions fell around 0.5% in 2025. Expanding low-emissions generation contributed, but so did slower electricity-demand growth and reduced cement and steel production. This is progress, not proof that a permanent national emissions decline has been secured.[15]
The 2026 picture is uneven
CREA’s September snapshot estimates that combined coal- and gas-fired electricity generation fell year-on-year for a third consecutive month, with additional solar, wind and nuclear generation covering demand growth. Some of those recent generation figures are model estimates and may be revised.[16]
The same assessment reports that January–August solar installations were down 58% against the exceptional 2025 comparison period, while thermal-power capacity additions accelerated. Domestic new-energy-vehicle sales also weakened even as exports grew. A transition can remain substantial without setting a new record in every month.
Grid investment is crucial. The IEA has highlighted how renewable construction can run ahead of transmission and system flexibility, leaving potentially useful output curtailed. China reached its earlier 2030 wind-and-solar capacity target in 2024, but achieving that equipment milestone is not the same as completing the energy transition.[17]
What deserves credit—and what does not
Solar panels, batteries and electric lorries should be judged by what they deliver, not by whether their country of origin fits a preferred political narrative. Industrial strategy, energy security, exports and lower operating costs can drive changes that also reduce emissions. Mixed motives do not make the physical benefits imaginary.
Equally, clean technology is not a certificate of harmlessness. A complete environmental examination must keep asking about land, materials, ecosystems, pollution and the durability of emissions reductions. Neither a photograph of a solar farm nor one of a smokestack can represent an entire country.
China is a leading force in the deployment and manufacture of technologies needed for the global transition. Several other countries already achieve cleaner electricity and stronger overall environmental outcomes. Both statements are supported by evidence.
Putting the record straight means recognising that difference. China’s continuing coal use deserves criticism; its extraordinary clean-technology deployment deserves credit. Treating one as a reason to erase the other leaves readers less informed.
Watch the researchers explain the evidence
The following recordings come from the organisations that produced key reports used here. They provide expert interpretation rather than independent verification of every claim; use the linked reports and their definitions to check specific numbers.
IEA: Global EV Outlook 2026 launch, 20 May 2026. The official presentation covers electric vehicles, charging, batteries and policy. Official event page and supporting material.[19]
Watch the IEA presentation on YouTube
Ember: China Energy Transition Review webinar, 8 September 2026. A discussion of China’s clean-energy expansion, coal use and integration challenges. Its date matters: it predates the October publication of CREA’s September snapshot. Official recording page.[20]
Watch the Ember webinar on YouTube
References and methodology
- IEA (2026), Global Energy Review 2026: Solar PV and wind. Figures for 2025; capacity is not electricity output.
- IEA (2026), Energy Technology Perspectives 2026: Supply chain risks and industrial competitiveness.
- IEA (2026), Global EV Outlook 2026: Trends in electric cars. EV totals include battery-electric and plug-in hybrid cars.
- IEA (2026), Global EV Outlook 2026: Trends in other EV modes. Medium- and heavy-freight truck definitions apply.
- IEA (2026), Global EV Outlook 2026: Executive summary. Policy and cost context for road-transport electrification.
- IEA (2026), Do electric cars reduce emissions overall? Lifecycle explanation accompanying Global EV Outlook 2026 (PDF).
- Ember (2026), Global Electricity Review: Major countries and regions. Electricity generation shares and carbon intensity, 2025.
- Ember, France country profile. Electricity generation mix, 2025.
- Ember, United Kingdom country profile. Electricity generation mix, 2025.
- Ember, Germany country profile. Electricity generation mix, 2025.
- Global Carbon Budget (2025), CO₂ emissions per capita, processed by Our World in Data. Territorial fossil and industrial CO₂; 2024 observations.
- Wendling and colleagues (2026), Environmental Performance Index, Yale Center for Environmental Law & Policy. Selected ranks among 177 countries.
- Yale, 2026 EPI FAQ. Data timing, methodological changes and limits on comparisons between editions.
- IEA (2026), Global Energy Review: Coal. Consumption, generation and plant commissioning in 2025.
- IEA (2026), Global Energy Review: CO₂ emissions. Energy-related emissions estimates for 2025.
- Centre for Research on Energy and Clean Air (October 2026), China Energy and Emissions Trends: September 2026 snapshot. Some recent generation figures are preliminary model estimates.
- IEA (2025), World Energy Investment: China. Historical investment, grid constraints and the early achievement of a capacity target.
- Norwegian Road Federation (OFV), 2025 ble tidenes rekordår for bilsalget. Norway’s 2025 new-car registration figures.
- IEA, Global EV Outlook 2026 launch, 20 May 2026. Official recording and supporting material.
- Ember, China Energy Transition Review launch, 8 September 2026. Official webinar recordings.
Method note: this article separates installed capacity from output; new sales from the existing fleet; battery-electric cars from the broader EV category; electricity from total energy; and territorial CO₂ from wider environmental outcomes. Country comparisons are selected examples, not an exhaustive world ranking. The video links were verified against the publishers’ official pages; the recordings have not been independently audited statement by statement.